3QFY2019 Result Update | Automobile
February 15, 2019
Mahindra & Mahindra Ltd.
BUY
CMP
`626
Performance Update
Target Price
`850
Y/E March (` cr)
3QFY19
3QFY18
% yoy
2QFY19
% qoq
Investment Period
12 months
Net sales
13,070
11,578
12.9
12,989
0.6
EBITDA
1,437
1,494
(3.8)
1,605
(10.5)
Stock Info
EBITDA margin (%)
11.0
12.9
(190bp)
12.4
(136bp)
Sector
Automobile
Market Cap (` cr)
77,905
Adjusted PAT
1,144
920
24.4
1,544
(25.9)
Net Debt (` cr)
2,900
Source: Company, Angel Research
Beta
0.8
For 3QFY2019, revenues grew by ~13% yoy to `13,070cr. Operating margin
52 Week High / Low
992/619
declined by 190bps. On the bottom-line front, M&M reported growth of ~24%
Avg. Daily Volume
2,51,238
yoy to `1,144cr on the back of lower taxes.
Face Value (`)
5
BSE Sensex
35,725
Top-line grew ~13%: The company’s top-line grew by ~13% yoy to `13,070cr on
Nifty
10,669
the back of volume growth (up ~11% yoy) and realization improvement (up
Reuters Code
MAHM.BO
~1.9% yoy). Farm equipment segment grew by ~13% yoy during the quarter,
Bloomberg Code
MM.IN
whereas automotive segment reported a growth of ~12% yoy. Going forward, we
expect automotive and farm equipment segments to perform better on the back of
Shareholding Pattern (%)
positive rural sentiment and government's push for infra & construction projects.
Promoters
20.4
MF / Banks / Indian
20.7
Lower tax drives profitability: On the operating front, the company’s margin
FII / NRIs / OCBs
37.1
contracted by 190bps yoy to 11% due to lower volume growth, commodity cost
Indian Public/Others
21.8
pressure and new launch expenses. However, M&M reported ~24% yoy rise in
net profit to `1,144cr on the back of lower taxes.
Abs.(%)
3m
1yr
3yr
Outlook and Valuation: We expect M&M to report net revenue CAGR of ~12% to
Sensex
2.1
5.0
52.3
M&M
(17.7)
(15.0)
3.7
~`60,634cr over FY2018-20E mainly due to healthy growth in automobile
segment i.e. utility vehicles (on the back of new launches and facelift of some
models) and strong growth in tractors segment driven by brand recall and
improvement in rural sentiment. Further, on the bottom-line front, we expect
CAGR of ~16% to `5,429cr over the same period on the back of margin
improvement. Thus, we recommend BUY on the stock with a Target Price of `850.
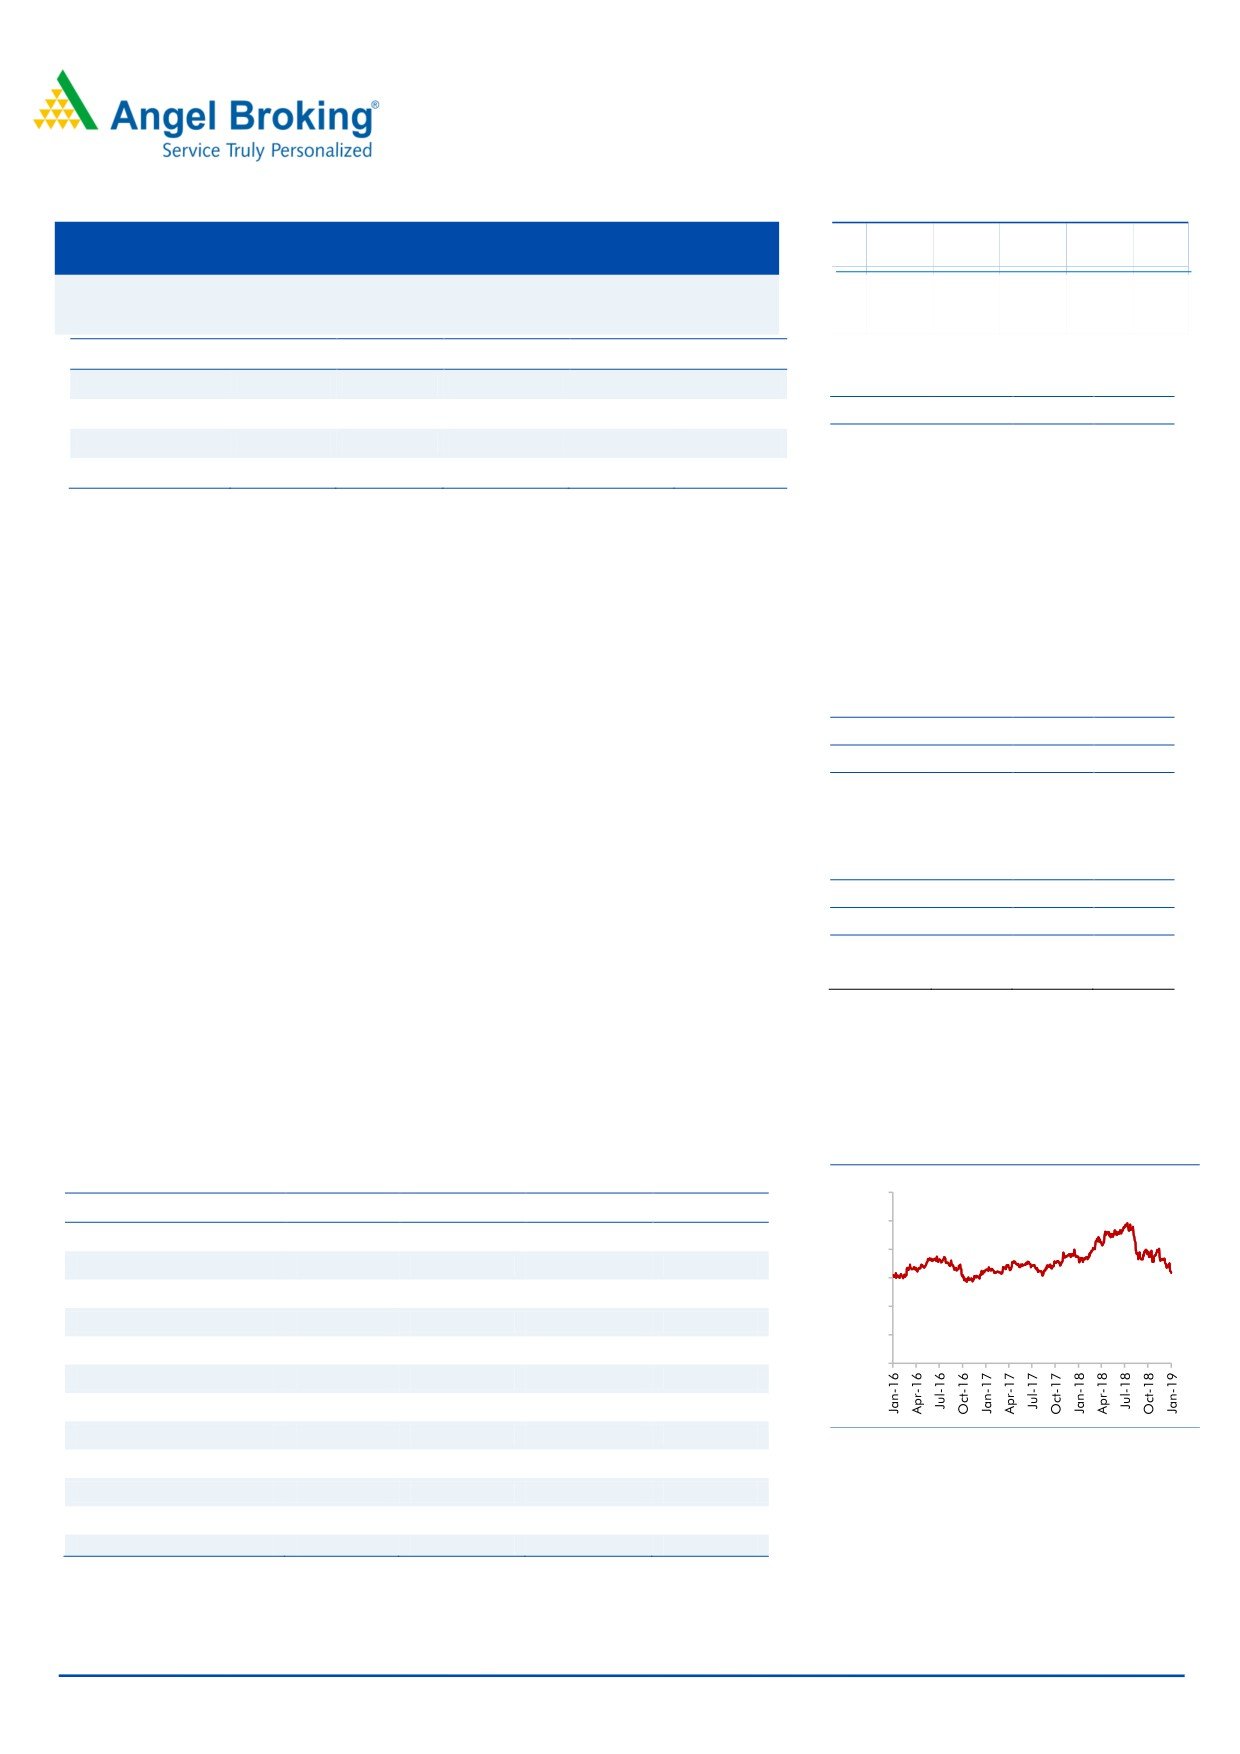
Historical share price chart
Key Financials
1,200
Y/E March (` cr)
FY2017
FY2018
FY2019E
FY2020E
1,000
Net sales
44,054
48,686
54,041
60,634
800
% chg
7.8
10.5
11.0
12.2
600
Adj. Net profit
3,220
4,046
4,751
5,429
400
% chg
0.4
25.7
17.4
14.3
200
EBITDA margin (%)
10.2
12.8
12.6
12.7
0
EPS (`)
27.1
34.0
39.9
45.6
P/E (x)
23.1
18.4
15.7
13.7
P/BV (x)
2.9
2.5
2.2
1.9
Source: Company, Angel Research
RoE (%)
12.5
13.4
14.0
14.2
RoCE (%)
10.5
14.3
13.5
13.6
Amarjeet S Maurya
EV/Sales (x)
1.3
1.1
1.0
0.9
022-40003600 Ext: 6831
EV/EBITDA (x)
12.8
8.7
8.3
7.2
Source: Company, Angel Research Note
Please refer to important disclosures at the end of this report
1
Mahindra & Mahindra| 3QFY2019 Result Update
Exhibit 1: 3QFY2019 Performance
Y/E March (` cr)
3QFY19
3QFY18
% yoy
2QFY19
% qoq
9MFY19
9MFY18
% chg
Net Sales
13,070
11,578
12.9
12,989
0.6
39,579
35,378
11.9
Consumption of RM
9407
8031
17.1
9256
1.6
28220
24898
13.3
(% of Sales)
72.0
69.4
71.3
71.3
70.4
Staff Costs
778
723
7.6
742
4.8
2270.9
2134.6
6.4
(% of Sales)
5.9
6.2
5.7
5.7
6.0
Other Expenses
1,449
1,331
8.9
1,386
4.5
4094.5
3875.0
5.7
(% of Sales)
11.1
11.5
10.7
10.3
11.0
Total Expenditure
11,633
10,084
15.4
11,384
2.2
34,585
30,908
11.9
Operating Profit
1,437
1,494
(3.8)
1,605
(10.5)
4,994
4,470
11.7
OPM
11.0
12.9
12.4
12.6
12.6
Interest
25
25
1.1
28
(9.9)
85.3
79.2
7.7
Depreciation
474
369
28.2
461
2.6
1327.9
1080.1
22.9
Other Income
341
484
846
1527.2
1250.6
PBT (excl. Ext Items)
1,280
1,584
(19.2)
1,962
(34.8)
5,108
4,561
12.0
Ext (Income)/Expense
134
PBT (incl. Ext Items)
1,280
1,584
(19.2)
2,096
(39.0)
5,108
4,561
12.0
(% of Sales)
9.8
13.7
16.1
12.9
12.9
Provision for Taxation
203
368
447
1,161
1264
(8.2)
(% of PBT)
15.9
23.2
21.3
23
28
Reported PAT
1,077
1,216
(11.4)
1,649
(34.7)
3,947
3,297
19.7
PATM
8.2
10.5
12.7
10.0
9.3
Minority Interest After NP
Extra-ordinary Items
67
296
(105)
58.0
278.8
Reported PAT
1,144
920
24.4
1,544
(25.9)
3,889.3
3,018.1
28.9
Source: Company, Angel Research
February 15, 2019
2
Mahindra & Mahindra| 3QFY2019 Result Update
Outlook and Valuation: We expect M&M to report net revenue CAGR of ~12% to
~`60,634cr over FY2018-20E mainly due to healthy growth in automobile
segment i.e. utility vehicles (on the back of new launches and facelift of some
models) and strong growth in tractors segment driven by brand recall and
improvement in rural sentiment. Further, on the bottom-line front, we expect CAGR
of ~16% to `5,429cr over the same period on the back of margin improvement.
Thus, we recommend BUY on the stock with a Target Price of `850.
Downside risks to our estimates
Strong launches from competitors like Maruti Suzuki, Hyundai Motors and
Ford can grab the market share from M&M.
Poor monsoon can impact the overall earnings growth (47% EBIT contribution
from tractors segment).
Lower growth and profitability of subsidiary companies can limit upside
growth.
Company Background
Mahindra & Mahindra Ltd (M&M) is an India based company. The company
operates in nine segments i.e. automotive segment comprises sales of
automobiles, spare parts and related services; farm equipment segment comprises
sales of tractors, spare parts and related services; information technology (IT)
services comprises services rendered for IT and telecom; financial services
comprises services relating to financing, leasing and hire purchase of automobiles
and tractors; steel trading and processing; infrastructure comprising operating of
commercial complexes, project management and development; hospitality
segment comprises sale of timeshare; Systech segment comprises automotive
components and other related products and services, and others segment
comprise s logistics, aftermarket, two wheelers and investment.
February 15, 2019
3
Mahindra & Mahindra| 3QFY2019 Result Update
Standalone Profit & Loss Statement
Y/E March (` cr)
FY2017
FY2018
FY2019E
FY2020E
Total operating income
44,054
48,686
54,041
60,634
% chg
7.8
10.5
11.0
12.2
Total Expenditure
39,539
42,462
47,232
52,933
Raw Material
32,082
34,135
38,099
42,747
Personnel
2,714
2,841
3,459
3,881
Others Expenses
4,742
5,486
5,674
6,306
EBITDA
4,515
6,224
6,809
7,701
% chg
(2.3)
37.9
9.4
13.1
(% of Net Sales)
10.2
12.8
12.6
12.7
Depreciation& Amortisation
1,526
1,479
1,808
2,093
EBIT
2,988
4,745
5,001
5,608
% chg
(15.9)
58.8
5.4
12.1
(% of Net Sales)
6.8
9.7
9.3
9.2
Interest & other Charges
160
112
109
109
Other Income
1,894
1,470
1,800
1,800
(% of PBT)
40.1
24.1
26.9
24.7
Share in profit of Associates
-
-
-
-
Recurring PBT
4,723
6,102
6,692
7,299
% chg
10.2
29.2
9.7
9.1
Tax
1,079
1,746
1,941
1,870
(% of PBT)
22.9
28.6
29.0
25.6
PAT (reported)
3,643
4,356
4,751
5,429
Extraordinary Items
423
310
-
-
ADJ. PAT
3,220
4,046
4,751
5,429
% chg
0.4
25.7
17.4
14.3
(% of Net Sales)
7.3
8.3
8.8
9.0
Basic EPS (Rs)
27.1
34.0
39.9
45.6
Fully Diluted EPS (`)
27.1
34.0
39.9
45.6
% chg
0.4
25.7
17.4
14.3
February 15, 2019
4
Mahindra & Mahindra| 3QFY2019 Result Update
Standalone Balance Sheet
Y/E March (` cr)
FY2017
FY2018
FY2019E
FY2020E
SOURCES OF FUNDS
Equity Share Capital
297
595
595
595
Reserves& Surplus
25,373
29,699
33,405
37,639
Shareholders Funds
25,670
30,294
34,000
38,234
Total Loans
2,816
2,958
2,958
2,958
Deferred Tax Liability
1,637
1,767
1,767
1,767
Total Liabilities
30,122
35,019
38,725
42,959
APPLICATION OF FUNDS
Gross Block
14,938
16,878
16,938
17,938
Less: Acc. Depreciation
7,303
9,019
10,827
12,919
Net Block
7,635
7,859
6,111
5,018
Capital Work-in-Progress
2,038
3,129
3,129
3,129
Investments
17,902
20,583
17,902
17,902
Current Assets
11,764
15,846
20,456
26,813
Inventories
2,716
2,702
3,553
4,319
Sundry Debtors
2,918
3,173
4,146
4,984
Cash
1,687
2,894
3,030
4,170
Loans & Advances
1,528
3,769
5,404
7,276
Other Assets
2,914
3,309
4,323
6,063
Current liabilities
10,158
13,887
10,363
11,392
Net Current Assets
1,605
1,958
10,093
15,420
Deferred Tax Asset
942
1,489
1,489
1,489
Mis. Exp. not written off
-
-
-
-
Total Assets
30,122
35,019
38,725
42,959
February 15, 2019
5
Mahindra & Mahindra| 3QFY2019 Result Update
Standalone Cashflow Statement
Y/E March (` cr)
FY2017
FY2018
FY2019E FY2020E
Profit before tax
4639
5669
6692
7299
Depreciation
1327
1479
1808
2093
Change in Working Capital
(31)
1780
(7999)
(4186)
Interest / Dividend (Net)
(834)
112
0
0
Direct taxes paid
0
(1289)
(1941)
(1870)
Others
(138)
(725)
0
0
Cash Flow from Operations
4964
7027
(1440)
3335
(Inc.)/ Dec. in Fixed Assets
(2060)
(2669)
(1000)
(1000)
(Inc.)/ Dec. in Investments
(1160)
(2441)
0
0
Cash Flow from Investing
(3221)
(5110)
(1000)
(1000)
Issue of Equity
0
0
0
0
Inc./(Dec.) in loans
0
0
0
0
Dividend Paid (Incl. Tax)
(839)
(923)
(1045)
(1194)
Interest / Dividend (Net)
(59)
3834
0
0
Cash Flow from Financing
(898)
2911
(1045)
(1194)
Inc./(Dec.) in Cash
845
4828
(3485)
1140
Opening Cash balances
842
1687
6515
3030
Closing Cash balances
1687
6515
3030
4170
February 15, 2019
6
Mahindra & Mahindra| 3QFY2019 Result Update
Key Ratios
Y/E March
FY2017
FY2018
FY2019E FY2020E
Valuation Ratio (x)
P/E (on FDEPS)
23.1
18.4
15.7
13.7
P/CEPS
14.4
12.8
11.4
9.9
P/BV
2.9
2.5
2.2
1.9
Dividend yield (%)
1.0
1.2
1.4
1.6
EV/Sales
1.3
1.1
1.0
0.9
EV/EBITDA
12.8
8.7
8.3
7.2
EV / Total Assets
1.9
1.5
1.5
1.3
Per Share Data (`)
EPS (Basic)
27.1
34.0
39.9
45.6
EPS (fully diluted)
27.1
34.0
39.9
45.6
Cash EPS
43.4
49.0
55.1
63.2
DPS
6.0
7.5
8.8
10.0
Book Value
215.7
254.6
285.7
321.3
Returns (%)
ROCE
10.5
14.3
13.5
13.6
Angel ROIC (Pre-tax)
33.6
48.5
31.2
29.3
ROE
12.5
13.4
14.0
14.2
Turnover ratios (x)
Asset Turnover (Gross Block)
2.9
2.9
3.2
3.4
Inventory / Sales (days)
22
20
24
26
Receivables (days)
24
24
28
30
Payables (days)
53
58
45
44
Working capital cycle (ex-cash) (days)
(7)
(14)
7
12
February 15, 2019
7
Mahindra & Mahindra| 3QFY2019 Result Update
Research Team Tel: 022 - 39357800
DISCLAIMER
Angel Broking Limited (hereinafter referred to as “Angel”) is a registered Member of National Stock Exchange of India Limited, Bombay
Stock Exchange Limited, Metropolitan Stock Exchange Limited, Multi Commodity Exchange of India Ltd and National Commodity &
Derivatives Exchange Ltd It is also registered as a Depository Participant with CDSL and Portfolio Manager and Investment Adviser with
SEBI. It also has registration with AMFI as a Mutual Fund Distributor. Angel Broking Limited is a registered entity with SEBI for Research
Analyst in terms of SEBI (Research Analyst) Regulations, 2014 vide registration number INH000000164. Angel or its associates has not
been debarred/ suspended by SEBI or any other regulatory authority for accessing /dealing in securities Market. Angel or its
associates/analyst has not received any compensation / managed or co-managed public offering of securities of the company covered
by Analyst during the past twelve months.
This document is solely for the personal information of the recipient, and must not be singularly used as the basis of any investment
decision. Nothing in this document should be construed as investment or financial advice. Each recipient of this document should make
such investigations as they deem necessary to arrive at an independent evaluation of an investment in the securities of the companies
referred to in this document (including the merits and risks involved), and should consult their own advisors to determine the merits and
risks of such an investment.
Reports based on technical and derivative analysis center on studying charts of a stock's price movement, outstanding positions and
trading volume, as opposed to focusing on a company's fundamentals and, as such, may not match with a report on a company's
fundamentals. Investors are advised to refer the Fundamental and Technical Research Reports available on our website to evaluate the
contrary view, if any
The information in this document has been printed on the basis of publicly available information, internal data and other reliable
sources believed to be true, but we do not represent that it is accurate or complete and it should not be relied on as such, as this
document is for general guidance only. Angel Broking Limited or any of its affiliates/ group companies shall not be in any way
responsible for any loss or damage that may arise to any person from any inadvertent error in the information contained in this report.
Angel Broking Limited has not independently verified all the information contained within this document. Accordingly, we cannot testify,
nor make any representation or warranty, express or implied, to the accuracy, contents or data contained within this document. While
Angel Broking Limited endeavors to update on a reasonable basis the information discussed in this material, there may be regulatory,
compliance, or other reasons that prevent us from doing so.
This document is being supplied to you solely for your information, and its contents, information or data may not be reproduced,
redistributed or passed on, directly or indirectly.
Neither Angel Broking Limited, nor its directors, employees or affiliates shall be liable for any loss or damage that may arise from or in
connection with the use of this information.
Disclosure of Interest Statement
M&M
1. Financial interest of research analyst or Angel or his Associate or his relative
No
2. Ownership of 1% or more of the stock by research analyst or Angel or associates or relatives
No
3. Served as an officer, director or employee of the company covered under Research
No
4. Broking relationship with company covered under Research
No
Note: We have not considered any Exposure below ` 1 lakh for Angel, its Group companies and Directors
Ratings (Returns):
Buy (> 15%)
Accumulate (5% to 15%)
Neutral (-5 to 5%)
Reduce (-5% to -15%)
Sell (< -15%)
February 15, 2019
8